Monitoring a local RADIUS VM using the PRTG Network Monitor
In this topic, you will learn how to monitor your local RADIUS virtual machine using the PRTG Network Monitor.
Before you begin:
-
We assume that you already have a virtual machine with the PRTG Network Monitor server running, and that you already have a local RADIUS server configured and running.
-
Make sure that the virtual machine hosting the PRTG Network Monitor server can connect to the local RADIUS virtual machine on UDP ports 1812 and 1813 for RADIUS, and on UDP ports 161 and 162 for SNMP.
-
If you plan to use syslog, also make sure that the local RADIUS virtual machine can connect to the PRTG Network Monitor server on UDP port 514.
Configure the local RADIUS server
In this section, you will learn how to configure your local RADIUS server virtual machine to work with the PRTG Network Monitor. You must complete these steps, or some of the steps in the later sections will not work.
-
Activate the Enable SNMP v1 and v2c checkbox, and in the Community
String field, enter the community string you want to use.
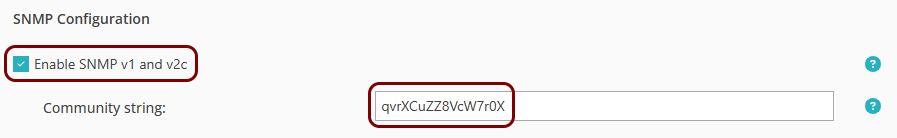 Note:The default string is public, but for security reasons, we recommend that you use a different string. In a lab environment, you can use the default string, which will allow you to skip some configuration steps in PRTG Network Monitor.
 - Optional:
In the Syslog Destination field, enter the IP address of your PRTG Network Monitor
server.
The local RADIUS server will send syslog information to this IP address.

-
Click on the Save button to save your configuration changes.
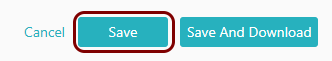 Note:If your local RADIUS machine is already running, configuration changes will be sent to it the next time it synchronizes with Portnox Cloud, within 1 minute. If the local RADIUS machine is new, click on the Save And Download button instead, and follow this guide to set up the virtual machine using the downloaded ISO file: Set up a local RADIUS server using a virtual machine
The local RADIUS server will now be available for monitoring via SNMP from the PRTG Network Monitor, and will optionally send syslog logs to the PRTG Network Monitor for additional information.
Configure a Portnox Cloud account and group
In this section, you will learn how to set up a Portnox Cloud account and group exclusively for testing the local RADIUS server. You must complete these steps, or some of the steps in the later sections will not work.
-
In Portnox Cloud, go to: , and configure the new group as follows:
Note:You can use an existing group, but we strongly recommend that you create a new group just for this purpose, because of the unique configuration requirements. If you change the configuration of your existing groups, it may affect the accounts already assigned to those groups.
-
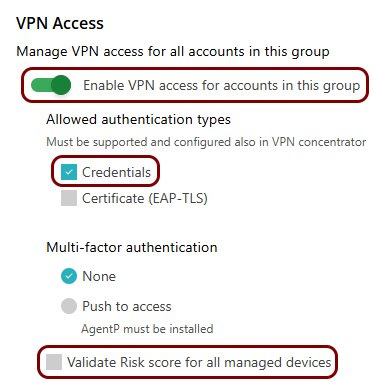
In the VPN Access section, activate the Enable VPN access for accounts in
this group switch, activate the Credentials checkbox, and deactivate
the Validate Risk score for all managed devices checkbox.
-
In the VPN Access section, activate the Enable VPN access for accounts in
this group switch, activate the Credentials checkbox, and deactivate
the Validate Risk score for all managed devices checkbox.
Set up the PRTG Network Monitor
In this section, you will learn how to set up the PRTG Network Monitor to monitor your local RADIUS virtual machine by using different types of sensors.
-
Configure the community string for SNMP:
Note:Skip this step if you configured the default community string public in Portnox Cloud.
-
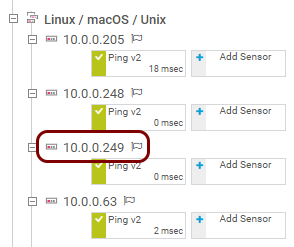
Go to , and click on the IP address of your local RADIUS server.
-
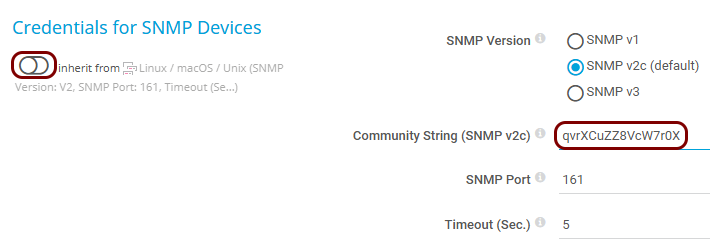
On the Device screen, click on the Settings tab, scroll down to
the Credentials for SNMP Devices section, deactivate the inherit
from switch, and in the Community String (SNMP v2c) field, enter the
community string that you configured earlier in Portnox Cloud. Then, click on the
Save button.
- Optional:
Go back to the screen, right-click on the IP address of your local RADIUS server, and select: .
This will allow the PRTG Network Monitor to immediately gather more information about the local RADIUS server using the default sensors.

-
Go to , and click on the IP address of your local RADIUS server.
-
Add a RADIUS sensor:
-
On the screen, find your local RADIUS server, and then click on the Add
Sensor tile at the end of the list of sensor tiles.

-
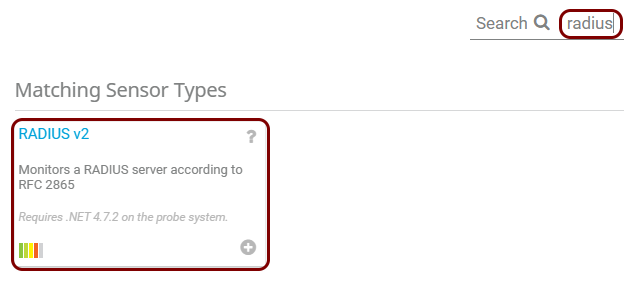
On the Add Sensor to Device screen, in the Search field, type:
radius, and then in the Matching Sensor Types list, click
on the RADIUS v2 tile.
-
In the Specific Sensor Settings section, fill in the following fields:
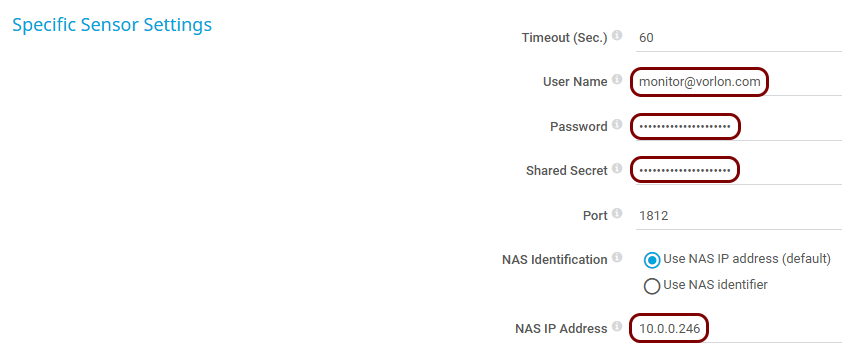
-
User Name: enter the email address that you used to create the Portnox account earlier.
-
Password: enter the password that you set when you created the Portnox account earlier (you were asked to save it in a temporary file).
-
Shared Secret: enter the shared secret for your local RADIUS server (you were asked to save it in a temporary file).
-
NAS IP Address: enter the IP address of the PRTG Network Monitor server.
-
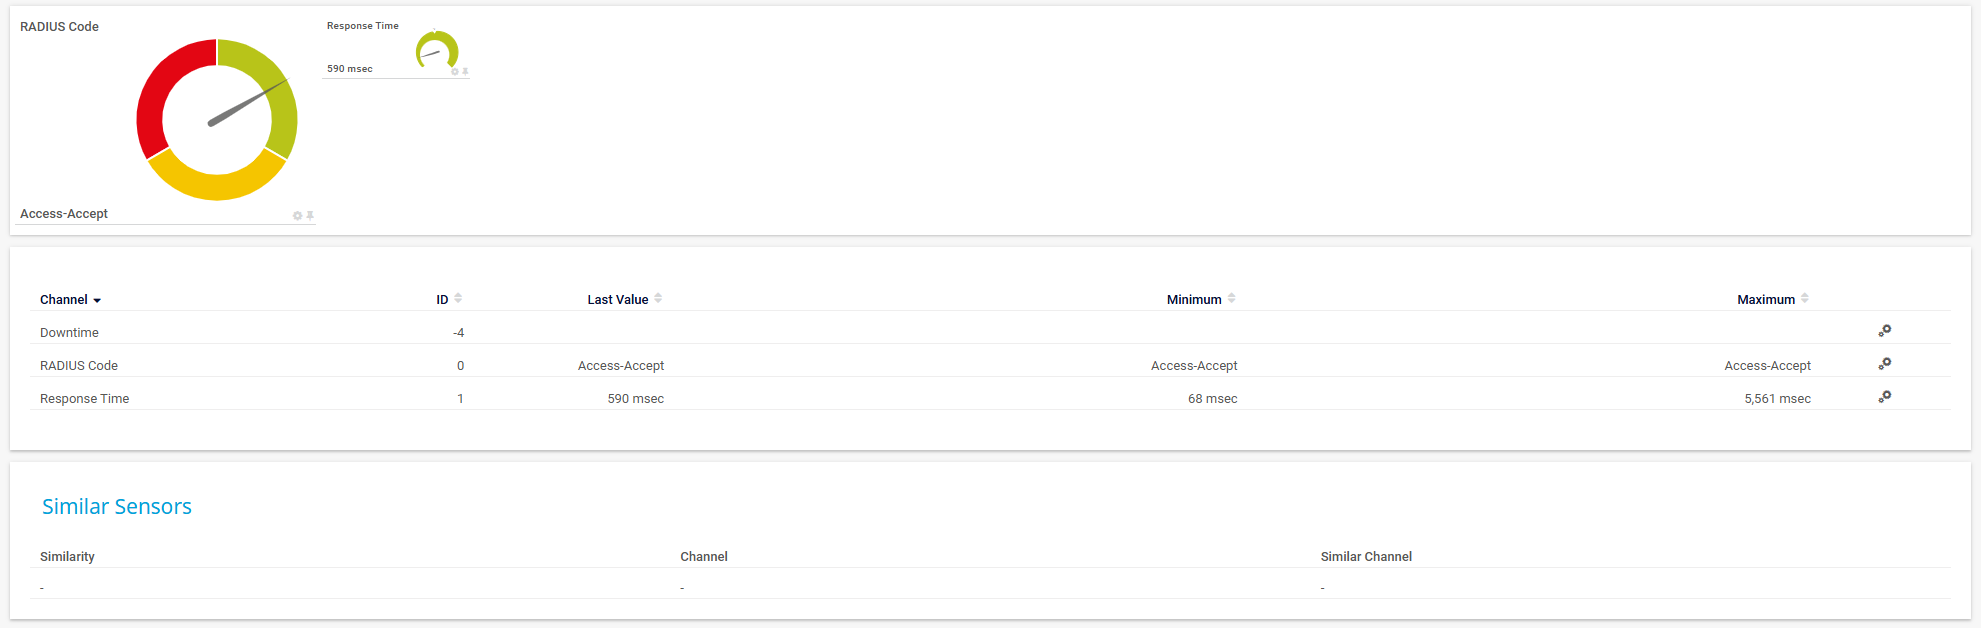
Example of a working RADIUS sensor:
-
On the screen, find your local RADIUS server, and then click on the Add
Sensor tile at the end of the list of sensor tiles.
-
Add a syslog sensor:
Note:Only add this sensor if you added the IP address of the PRTG Network Monitor server in the Syslog Destination field in Portnox Cloud. If you did not do this, the sensor will not receive any information.
-
On the screen, find your local RADIUS server, and then click on the Add
Sensor tile at the end of the list of sensor tiles.
-
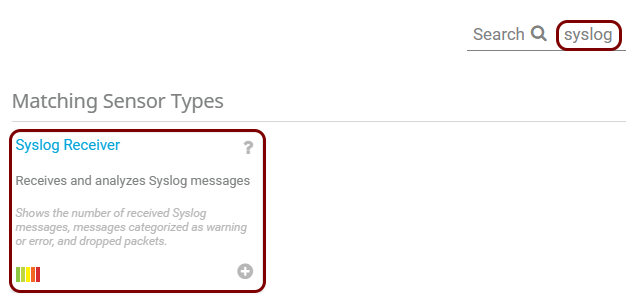
On the Add Sensor to Device screen, in the Search field, type:
syslog, and then in the Matching Sensor Types list, click
on the Syslog Receiver tile.
Example of a working Syslog sensor:
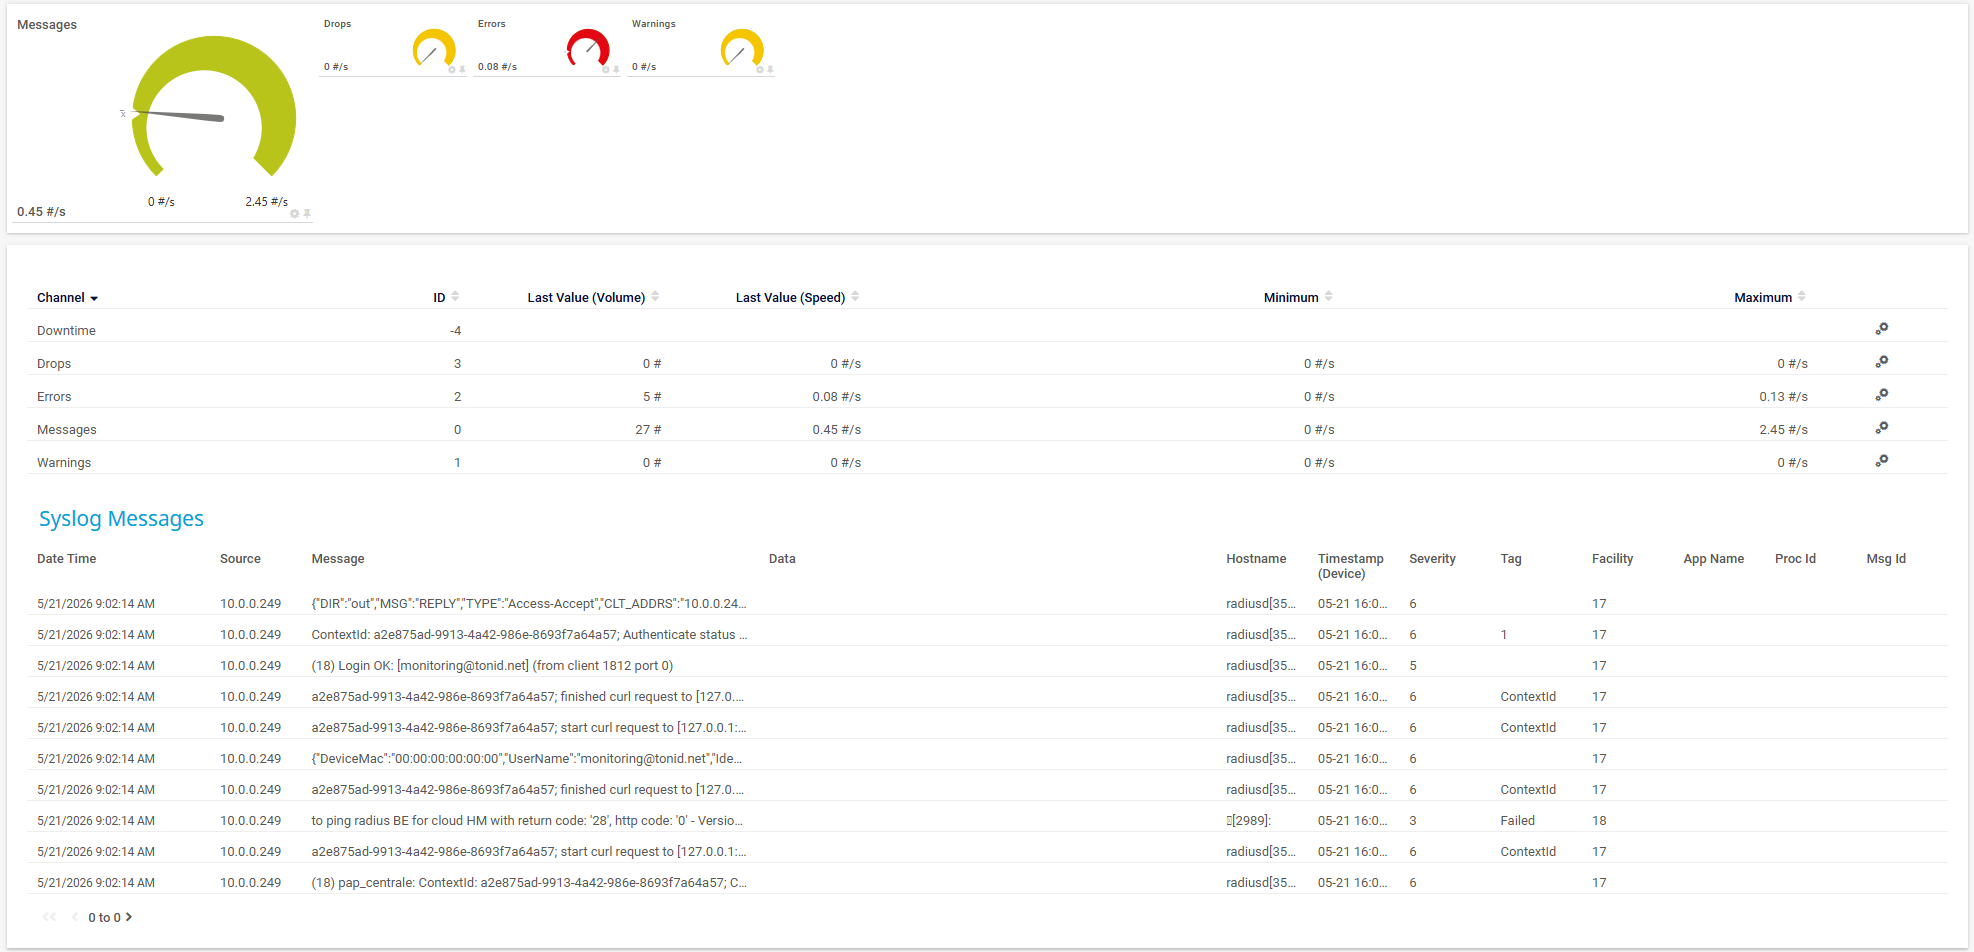
-
On the screen, find your local RADIUS server, and then click on the Add
Sensor tile at the end of the list of sensor tiles.
The following are recommendations for what to monitor for the local RADIUS server:
-
Monitor the CPU and memory of the server by using the default CPU Load and Physical Memory sensors.
-
Monitor the network connectivity of the server by using the default Ping V2 sensor, focusing on the Packet Loss and Response Time field values.
Note:When the RADIUS server is unreachable or in the Down state, all other sensors are paused, because they are dependent on the ping sensor. -
Track the number of authentications to monitor the load. Local RADIUS server resource utilization depends on the number of RADIUS authentication and accounting packets processed. If you monitor this number over time, you can establish a baseline (for example, 7 days of data) and decide whether an increase in CPU or memory resources is needed.
You can do this by using the Syslog sensor (an existing one, or a new one) with the following filter:
message[Access-Request] or message[Access-Accept] or message[Access-Reject]Note:Addmessage[Accounting-Request]to the filter to include accounting packets.In Notification Triggers, click on the + button, select Add Threshold Trigger, and in the new trigger, configure the rule:
When
                                        Messages channel reaches X per hour, perform
                                Notification
.